Understanding how to calculate GDP is key for those interested in economic fundamentals. We’ll focus on simplifying main formulas and approaches. These include the expenditure approach and the income approach for calculating Gross Domestic Product (GDP). GDP helps us understand a country’s economic health and direction.
The nominal GDP of the United States in 2018 hit $20.89 trillion. This highlights America’s economic power. GDP combines all goods and services produced, covering consumption, government spending, investments, and trade balance over a year. It shows our economic strength and vitality, leading us toward economic understanding.
Key Takeaways
- Understanding GDP is crucial for analyzing economic health and trends.
- GDP includes various components such as consumption, government spending, investments, and net exports.
- The expenditure approach formula, GDP = C + I + G + NX, helps calculate the total economic output.
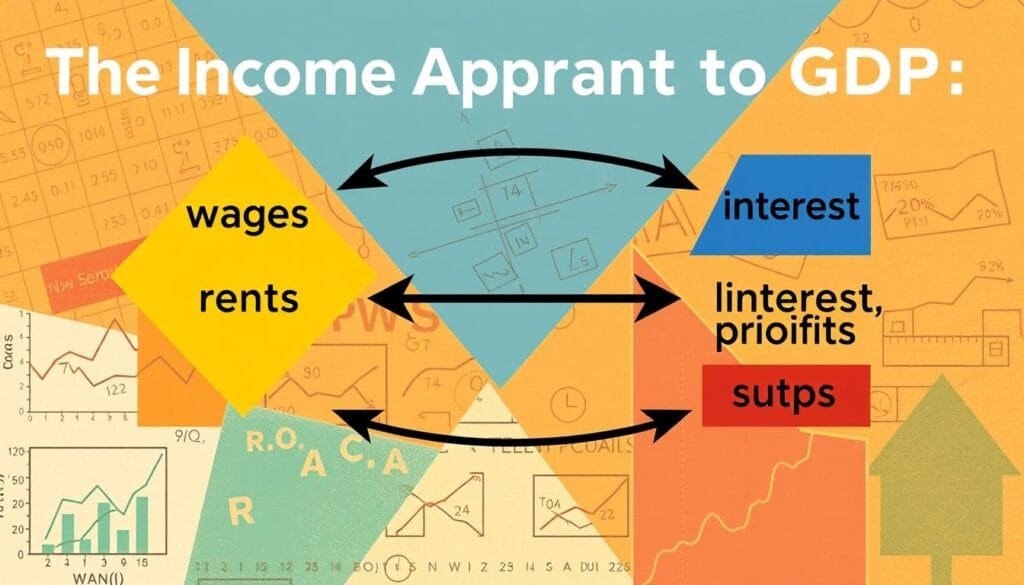
- The income approach is another method to arrive at GDP by totaling up wages, rents, interests, and profits.
- Identifying the influences of each component of GDP allows better interpretation of economic strategies.
- Changes in GDP figures, such as the 3.25% increase in real GDP in 2015 or the decline in 2017, can signal shifts in the economic landscape.
Understanding the Basics of GDP
GDP is a key way to see how a country’s economy is doing. It measures all the goods and services a country makes in a certain time. This shows us how healthy and strong an economy is.
What is GDP?
Gross Domestic Product, or GDP, tells us about the economy’s overall activity. It counts everything made in a country, from your morning coffee to big projects like bridges. Basically, if it’s made here, it adds to the GDP.
Why GDP Matters: An Overview
GDP is really important for checking on the economy. Experts and leaders look at GDP to see if the economy is doing well. If GDP goes up, the economy is growing. If it drops, there might be trouble ahead.
Depending on GDP, policies might change to help the economy grow or control inflation. For example, a government might spend more or change interest rates to boost growth.
The Difference Between Nominal and Real GDP
There are two ways to measure GDP: nominal and real. Nominal GDP looks at output using today’s prices. But it doesn’t consider inflation, so it might not be totally accurate.
Real GDP, however, adjusts for inflation. This gives a clearer picture of economic performance over time. It shows the real value of what’s being made.
Understanding the difference between nominal and real GDP helps us get the full picture of an economy. It can guide policy decisions and personal investments.
| Characteristic | Nominal GDP | Real GDP |
|---|---|---|
| Pricing Basis | Current Prices | Constant Prices |
| Adjustment for Inflation | No | Yes |
| Use for Comparison | Less Accurate for Long-term | Ideal for Long-term Trends |
| Reflection of Reality | Can be distorted by inflation/deflation | More accurate and realistic measure |
How Do You Calculate GDP in Economics
To figure out the GDP growth rate, we need to look at the parts that make up a nation’s economy. There are a few ways to do this, with the GDP calculation focusing on spending, income, and what goods and services are made. Let’s dig into these methods and how they work in the economy:
First off, GDP measures all the money spent by people, companies, and the government over time. This method is called the expenditure approach. On the flip side, if we add up everyone’s earnings, we get the income approach. Both ways aim to accurately measure economic output. They help us see the economy’s health from different angles.

Now, to get a more accurate growth picture, we adjust for inflation. This gives us the Real GDP. It shows us the true growth of an economy, minus inflation’s ups and downs. Knowing Real GDP is key to understanding how an economy truly moves over time.
To make things clearer, check out this table. It shows the different methods, what they involve, and why they’re important:
| Method | Components | Description | Importance |
|---|---|---|---|
| Expenditure | Consumer Spending (C), Investment (I), Government Spending (G), Net Exports (X – M) | Summation of total spending within an economy. | Reflects the total dollar value of all goods and services produced over a specific time period. |
| Income | Wages, Rent, Capital Return, Entrepreneur’s Profit | Tallies earnings from production and services. | Shows the income generated by production, aiding in salary and policy adjustments. |
| Real GDP | Adjustment for Inflation | Calculates growth by removing inflation’s impact. | Offers a true reflection of the economy’s growth, allowing more accurate economic forecasting. |
Looking at real numbers, the US had a GDP of $27.4 trillion in 2023. It stays the world’s top economy. China comes next, with a GDP of $17.8 trillion. But, these big numbers need the right GDP growth rate analysis. This analysis gives the context needed to shape economic policies.
Exploring how GDP calculations work shows our dedication to making economic concepts easier to understand. By grasping these ideas, we can better understand global economy movements. This knowledge is vital for smart decision-making and creating effective policies.
Exploring the Expenditure Approach to GDP Calculation
The expenditure approach helps us deeply understand a nation’s economy by calculating GDP. It adds up all final goods and services bought. This shows how busy the economy is. The formula is: GDP = C + I + G + (X – M).
This means adding consumption, investments, government spending, and net exports. Each part shows a piece of the economic scene.
Breaking Down the Formula
The GDP formula includes several parts. Consumption (C) is often the biggest, showing personal spending. It covers both lasting and short-term goods and services.
Investments (I) mean spending on things like machines and buildings. These are key for future production. Government spending (G) pays for public services and infrastructure. Meanwhile, net exports (NX) show if a country earns more from its exports than it spends on imports.
Understanding Consumption (C)
Consumption spending is a big driver of economic activity. It can be more than two-thirds of GDP in a usual year. This spending covers healthcare, education, and fun activities. It shows how people live and helps many industries.
Government Spending (G) Explained
Government spending helps stabilize the economy. It is especially seen in building infrastructure and public services. Making up about 20% of GDP, this spending is crucial during slow economic times. It helps lessen the downturn.
The Role of Investments (I)
Capital investments are big but not as big as consumption. They make up about 15-18% of GDP. These investments show business confidence and future economic outlooks.
Net Exports (NX): What It Entails
Net exports measure the difference between earnings from exports and spending on imports. A positive figure means a country sells more than it buys. This boosts its GDP. But, strong consumer countries often import more. This can lead to negative net exports, like in the U.S. recently.
| Component | Description | % of GDP (Average) |
|---|---|---|
| Consumption (C) | Expenditures by households and non-profits | 68% |
| Investments (I) | Business investments in capital goods | 17% |
| Government Expenditures (G) | Spending on public services and infrastructure | 20% |
| Net Exports (NX) | Exports minus imports | -5% |
Insights into the Income Approach
The income approach is key to understanding how to calculate GDP. It shows the total output of an economy. It also tells us about the country’s total earnings. Let’s look closer at how this method works for figuring out GDP.
Total National Income: A Closer Look
Total national income (TNI) is very important in the income approach. It combines earnings from wages, rents, interests, and profits. For example, the recent GDP report in the United States showed a TNI number. This number helps us understand the economy’s health and size.
Knowing about TNI helps us see how much money people and businesses make. It gives insights into the economic health of a country.
Adjustments for Taxes, Depreciation, and Net Foreign Factor Income
To get the full GDP number from total national income, we need to make some adjustments. We adjust for things like sales taxes, depreciation, and net foreign factor income. These adjustments help shape the final GDP number.
Depreciation means assets lose value over time. This loss affects how much these assets can produce. By adjusting for depreciation, we make sure we’re not counting the value of old or broken machines too high.
Sales taxes collected by the government are also adjusted. These taxes don’t directly add to what’s produced. They are just moved around within the economy.
The net foreign factor income is very important in today’s global economy. It’s the difference between what foreigners earn here and what locals earn abroad. This adjustment makes sure the GDP shows what’s made within the country.
To better understand these GDP parts, here’s a table:
| Component | Description | Impact on GDP Calculation |
|---|---|---|
| Total National Income | Sum of all wages, rents, interests, and profits within the economy | Basic measure of domestic income |
| Sales Taxes | Revenue collected by the government through sales | Added to account for government transfers |
| Depreciation | Measure of the decline in value of assets over time | Adjusted to reflect true productive capacity |
| Net Foreign Factor Income | Difference between domestic income to foreigners and foreign income to nationals | Ensures GDP reflects domestic production |

Using the income approach helps us fully understand the economy’s state. It’s crucial for making smart choices. By including adjustments for sales taxes, depreciation, and net foreign factor income, we get a complete view of economic activity.
GDP’s Impact on Economic Policy and Investment Decisions
The link between GDP growth and economic policy is critical. Policy makers closely examine GDP reports, shaping the nation’s economic path. Investors also rely on these numbers to make smart decisions, adjusting their investments to the economic situation.
Economic Policies Shaped by GDP
When the U.S. Bureau of Economic Analysis (BEA) reports a 3% GDP increase for Q2 2024, it signals a strong economy. This rise, driven by consumer spending and investment in infrastructure, might lead to relaxed fiscal policies or more public spending.
GDP growth rates help design policies for economic stability. In slow growth periods, policy makers might boost the economy with stimulus measures.
GDP’s Influence on Investment Strategies
GDP reports guide investors, showing opportunities and risks. They use GDP data to see where the economy is headed. Changes in GDP growth impact where investors place their money, highlighting growing or shrinking sectors.
BEA’s detailed GDP data helps investors spot trends in industries. For instance, an uptick in private inventory signals a higher consumer goods demand. This could mean good news for retail sector stocks.

| Quarter | GDP Growth Rate | Main Contributors |
|---|---|---|
| Q1 2024 | 1.4% | Modest consumer expenditure |
| Q2 2024 | 3% | Consumer spending, private inventory investment, non-residential fixed investment |
GDP trends teach us about its role in shaping economic policy and guiding investments. These numbers show not just past progress but also predict the future economy. They help policy makers and investors create strategies that match the economic climate.
Conclusion
Learning to calculate GDP in economics is crucial. It shows us the economic activity’s rhythm. GDP is a reliable measure that tells us if a country’s economy is doing well or not. By looking at GDP from three angles – production, expenditure, and income – we get a full picture of economic strength. These methods show how important GDP is, using data from the European system of national and regional accounts (ESA) and the System of National Accounts.
The latest GDP numbers, like the recent U.S. real GDP growth, are more than numbers. They show a wide view of the economy, from family incomes to how much businesses are spending. Yet, things like income inequality and environmental concerns make us think beyond GDP. Understanding GDP well helps us push for indicators that show more about societal health and progress.
In short, GDP is key for managing our economy. But we should also pay attention to its limits. Moving towards measures that show both economic growth and overall well-being is necessary. Real GDP, adjusting for inflation, is still best for seeing how well the economy performs. Learning about GDP helps us make better public policies, investment choices, and understand the world’s economy better.
FAQ
What is GDP and why is it used as an economic indicator?
GDP means Gross Domestic Product. It sums up the total value of all goods and services made within a country in a set time. It’s key for checking a nation’s economic health, indicating how well people live and the economy’s strength.
How is GDP calculated using the expenditure approach?
Using this method, GDP equals the total spent on all goods and services. This includes private consumption, government spending, investments, and net exports (exports minus imports). So, the formula is GDP = C + G + I + NX.
What is the difference between nominal GDP and real GDP?
Nominal GDP counts all production at current prices, not removing inflation. Real GDP, however, adjusts for inflation. It compares goods and services to those of a base year. This offers a truer look at economic growth.
Why do GDP growth rates matter to economic policymakers and investors?
GDP growth rates show how the economy is doing. Policymakers use them to tackle economic challenges like recession. Investors see GDP data as a guide to place their money where economies are growing stronger.
Can you explain the income approach to calculating GDP?
The income approach adds up all earnings from producing goods and services in a country. This means wages, rent, interest, and profits. It factors in adjustments for taxes, depreciation, and foreign income to get the Total National Income.
How do government expenditures influence GDP?
Government spending, part of the GDP, covers services and infrastructure. It boosts the economy by adding demand and jobs. This is a direct way governments can grow the economy.
What is the role of net exports in the GDP formula?
Net exports show the balance of trade. If a country exports more than it imports, it has a positive effect on GDP. This means it’s making more money from other countries than it spends on them.
How does calculating GDP help with understanding economic output?
GDP puts a number on the value of all produced goods and services. It serves as a gauge for economy size and health. It guides policymaking and investment by showing economic trends and comparisons.
What impact does GDP have on economic policy?
GDP guides policy since it reflects economic strength. Policymakers create strategies to keep the economy stable. They work to spur growth and lift living standards based on GDP and its changes.
How does GDP influence investment strategies?
GDP data shapes investment choices by showing economic health. Investors look for countries with strong growth. High-growth economies may bring better investment outcomes.
